Charts, Graphs and Diagrams
Infographics
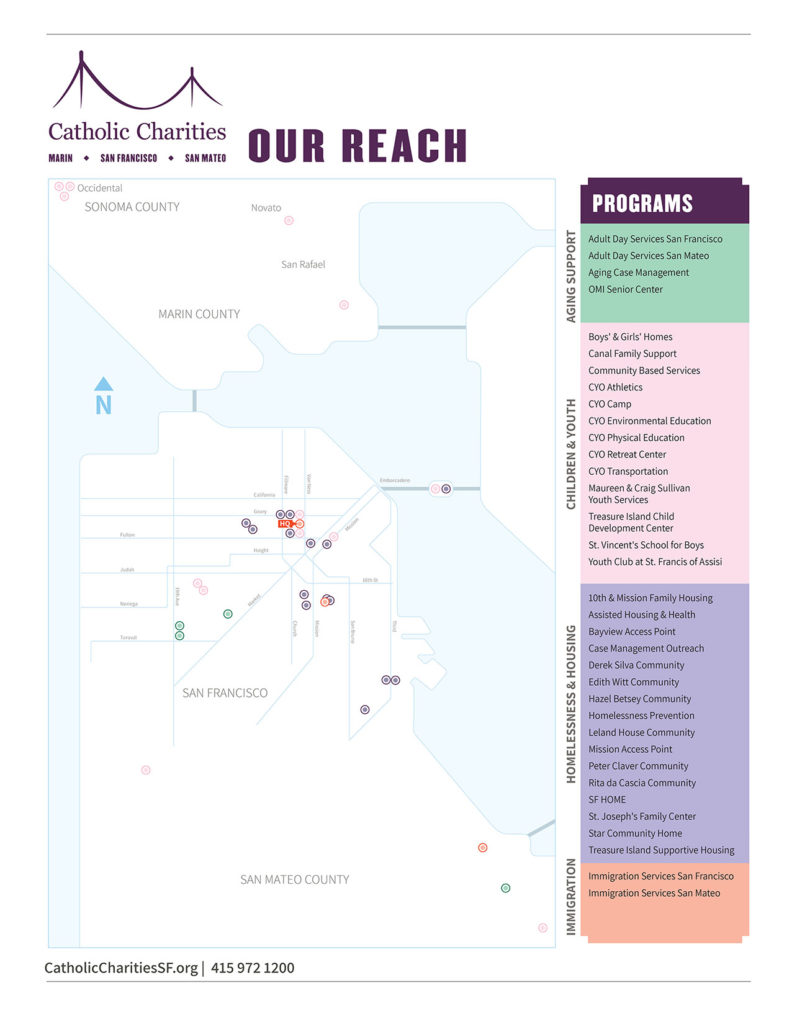
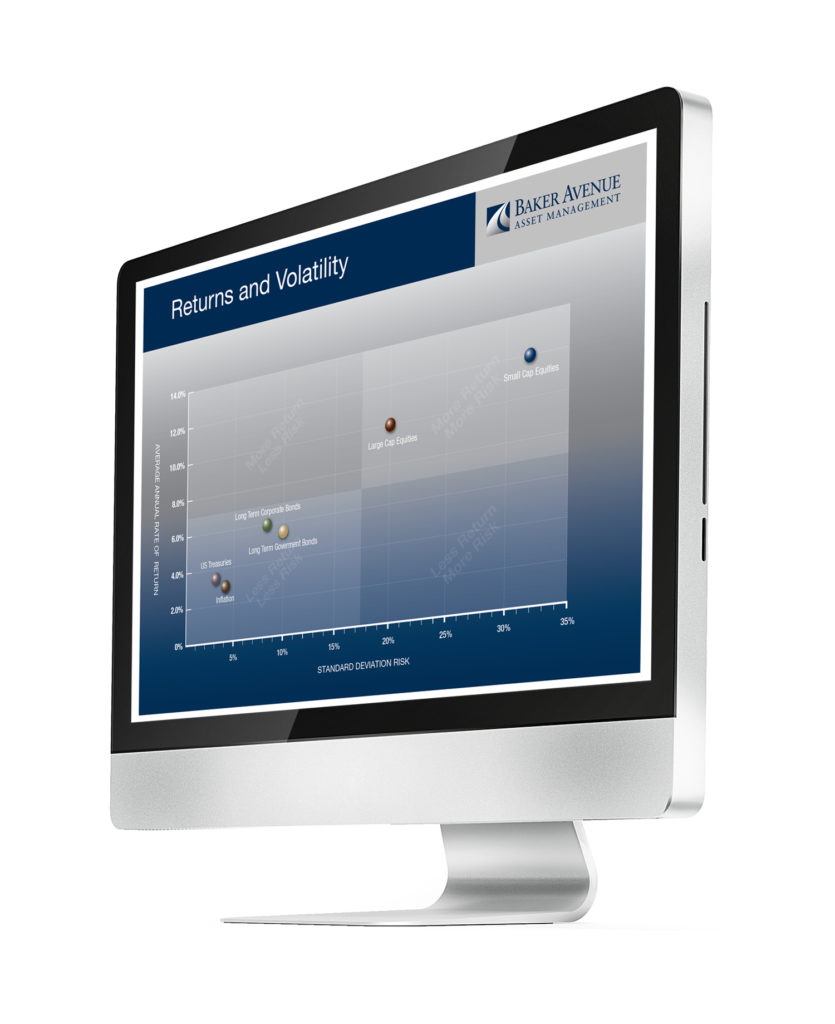
The purpose of statistical charts and diagrams is to express certain data in a rational, visible form that people can readily grasp and understand. What is important, when creating a chart is to use accurate data, to arrange it intelligently, and to work towards a concise and dynamic composition.
CLIENT
Various
ROLE
Graphic Design and Illustration
YEAR
2018
